Overview
This demo shows how to use PegasusN for mining large graphs. We will analyze a web graph by computing the degree, PageRank, radius distributions. Also, we generate a synthetic graph by R-MAT model. This demo is composed of the following four parts:
- Interactive shell
- Managing graphs
- Running algorithms
- Plotting results
Interactive shell
PegasusN supports an interactive shell so that users can manage graphs, run algorithms, and generate plots. To access the shell, type `bin/pegasus_hadoop.sh` or `bin/pegasus_spark.sh` for Hadoop and Spark, respectively, in the PegasusN installation directory. Then, the shell for PegasusN will appear. For available commands in the shell, type `help`.
[chiwanpark@dumbomaster pegasusN]$ bin/pegasus_hadoop.sh

  PegasusN: A Scalable and Versatile Graph Mining System
  Last modified September 25th 2017

  Authors: Ha-Myung Park, Chiwan Park, and U Kang
           Dept. of Computer Science and Engineering, Seoul National University

  Type `help` for available commands.
  The user manual is available at https://datalab.snu.ac.kr/pegasusn


PegasusN> help

    add [file or directory] [graph name]
        upload a local graph file or directory to HDFS
    del [graph_name]
        delete a graph
    list
        list graphs
    show [type of data] [graph name]
        show sampled data of a graph
    compute [algorithm] [graph name]
        run an algorithm on a graph
    generate [model]
        generate a synthetic graph
    plot [type of plot] [graph name]
        generate plots
    exit
        exit PegasusN
    help [command]
        show usage of a command
    help
        show this screen

PegasusN>
Managing graphs
To use PegasusN, the graphs to be analyzed should be uploaded to the Hadoop File System (HDFS). In the shell, the add command is used for uploading a graph to HDFS. To add a local edge file 'web-Google.txt' to HDFS and name it to 'google', issue the following command: `add web-Google.txt google`. You can see the list of the current graphs by the `list` command.
PegasusN> add web-Google.txt google
Graph google added.
PegasusN> list
=== GRAPH LIST ===

- google

PegasusN>
To see sampled edges of the graph we uploaded, use `show graph` command as follows:
PegasusN> show graph google
303743	785103
297794	786140
301831	782997
301280	780240
305476	777647
536687	778701
542086	783781
544036	779022
541117	777947
538187	785545
541962	788116
541776	783101
541913	778575
545244	779667
538756	783388
PegasusN>
As you see, the graph 'google' is added to HDFS. Now we are ready to run algorithms.
Running algorithms
We will compute the degree, PageRank, and the radius of the www graph. For the purpose, we use the compute command.
Degree
To compute the degree, use the `compute deg [graph_name]` command. On entering the command, it will ask additional parameters: the type of the degree, and the number of workers. In this demo, we use inout for the degree type, and 10 for the number of workers. After entering the parameters, the degree is computed on Hadoop or Spark.
PegasusN> compute deg google
Enter parameters: [degree type: in, out, inout] [# of workers]: in 10
17/09/24 15:17:11 INFO zlib.ZlibFactory: Successfully loaded & initialized native-zlib library
17/09/24 15:17:11 INFO compress.CodecPool: Got brand-new compressor [.deflate]
17/09/24 15:17:14 INFO client.RMProxy: Connecting to ResourceManager at dumbo060/172.20.1.60:8032
17/09/24 15:17:38 INFO input.FileInputFormat: Total input paths to process : 20
17/09/24 15:17:38 INFO mapreduce.JobSubmitter: number of splits:20
17/09/24 15:17:38 INFO mapreduce.JobSubmitter: Submitting tokens for job: job_1505043511289_0178
17/09/24 15:17:39 INFO impl.YarnClientImpl: Submitted application application_1505043511289_0178
17/09/24 15:17:39 INFO mapreduce.Job: The url to track the job: http://dumbo060:8088/proxy/application_1505043511289_0178/
17/09/24 15:17:39 INFO mapreduce.Job: Running job: job_1505043511289_0178
17/09/24 15:17:53 INFO mapreduce.Job: Job job_1505043511289_0178 running in uber mode : false
17/09/24 15:17:53 INFO mapreduce.Job:  map 0% reduce 0%
17/09/24 15:17:58 INFO mapreduce.Job:  map 55% reduce 0%
17/09/24 15:18:00 INFO mapreduce.Job:  map 90% reduce 0%
...
When the computation is finished, you will see the following messages.
[Degree] Degree computation is done.
[Degree] The in-degree of each vertex is stored in HDFS pegasus/degree/google/in.
PegasusN>
PageRank
To compute the PageRank, use the `compute pagerank [graph_name]` command. On entering the command, it will ask additional parameters: the number of partitioned vector blocks, the degree threshold to split dense region, and the damping factor. In this demo, we use 20 for the number of blocks, 60 for the degree threshold for dense regions, and 0.85 for the damping factor. After entering the parameters, the PageRank is computed on Hadoop or Spark.
PegasusN> compute pagerank google
Enter parameters: [# of blocks] [threshold for dense regions] [damping factor]: 20 60 0.85
17/09/24 15:01:34 INFO fs.TrashPolicyDefault: Namenode trash configuration: Deletion interval = 0 minutes, Emptier interval = 0 minutes.
Deleted pegasus/graphs-partitioned/google
[PageRank] Step 1: Pre-partition the graph matrix into multiple sub-matrices
17/09/24 15:01:37 INFO client.RMProxy: Connecting to ResourceManager at dumbo060/172.20.1.60:8032
17/09/24 15:01:38 INFO input.FileInputFormat: Total input paths to process : 80
17/09/24 15:01:38 INFO mapreduce.JobSubmitter: number of splits:80
17/09/24 15:01:38 INFO mapreduce.JobSubmitter: Submitting tokens for job: job_1505043511289_0172
17/09/24 15:01:38 INFO impl.YarnClientImpl: Submitted application application_1505043511289_0172
17/09/24 15:01:39 INFO mapreduce.Job: The url to track the job: http://dumbo060:8088/proxy/application_1505043511289_0172/
17/09/24 15:01:39 INFO mapreduce.Job: Running job: job_1505043511289_0172
17/09/24 15:01:44 INFO mapreduce.Job: Job job_1505043511289_0172 running in uber mode : false
17/09/24 15:01:44 INFO mapreduce.Job:  map 0% reduce 0%
17/09/24 15:01:49 INFO mapreduce.Job:  map 57% reduce 0%
17/09/24 15:01:50 INFO mapreduce.Job:  map 100% reduce 0%
...
[PageRank] Step 2: Compute PageRank scores using the pre-partitioned sub-matrices
17/09/24 15:02:16 INFO client.RMProxy: Connecting to ResourceManager at dumbo060/172.20.1.60:8032
17/09/24 15:02:17 INFO input.FileInputFormat: Total input paths to process : 840
17/09/24 15:02:17 INFO mapreduce.JobSubmitter: number of splits:20
17/09/24 15:02:17 INFO mapreduce.JobSubmitter: Submitting tokens for job: job_1505043511289_0173
17/09/24 15:02:17 INFO impl.YarnClientImpl: Submitted application application_1505043511289_0173
17/09/24 15:02:17 INFO mapreduce.Job: The url to track the job: http://dumbo060:8088/proxy/application_1505043511289_0173/
17/09/24 15:02:17 INFO mapreduce.Job: Running job: job_1505043511289_0173
17/09/24 15:02:22 INFO mapreduce.Job: Job job_1505043511289_0173 running in uber mode : false
17/09/24 15:02:22 INFO mapreduce.Job:  map 0% reduce 0%
17/09/24 15:11:29 INFO mapreduce.Job:  map 100% reduce 0%
...
When the computation is finished, you will see the following messages.
[PageRank] the PageRank result for google graph is stored in HDFS pegasus/pagerank/google.
PegasusN>
Radius
To compute the Radius, use the `compute radius [graph_name]` command. On entering the command, similarly to the PageRank algorithm, it will ask additional parameters: the number of partitioned blocks, and the degree threshold for dense regions. In this demo, we use 20 for the number of blocks and 60 for the degree threshold. After entering the parameters, the radius is computed on Hadoop or Spark.
PegasusN> compute radius google
Enter parameters: [# of blocks] [threshold for dense regions]: 20 60
17/09/24 15:01:34 INFO fs.TrashPolicyDefault: Namenode trash configuration: Deletion interval = 0 minutes, Emptier interval = 0 minutes.
Deleted pegasus/graphs-partitioned/google
[Radius] Step 1: Pre-partition the graph matrix into multiple sub-matrices
17/09/24 15:01:37 INFO client.RMProxy: Connecting to ResourceManager at dumbo060/172.20.1.60:8032
17/09/24 15:01:38 INFO input.FileInputFormat: Total input paths to process : 80
17/09/24 15:01:38 INFO mapreduce.JobSubmitter: number of splits:80
17/09/24 15:01:38 INFO mapreduce.JobSubmitter: Submitting tokens for job: job_1505043511289_0174
17/09/24 15:01:38 INFO impl.YarnClientImpl: Submitted application application_1505043511289_0174
17/09/24 15:01:39 INFO mapreduce.Job: The url to track the job: http://dumbo060:8088/proxy/application_1505043511289_0174/
17/09/24 15:01:39 INFO mapreduce.Job: Running job: job_1505043511289_0174
17/09/24 15:01:44 INFO mapreduce.Job: Job job_1505043511289_0174 running in uber mode : false
17/09/24 15:01:44 INFO mapreduce.Job:  map 0% reduce 0%
17/09/24 15:01:49 INFO mapreduce.Job:  map 57% reduce 0%
17/09/24 15:01:50 INFO mapreduce.Job:  map 100% reduce 0%
...
[Radius] Step 2: Compute effective radius using the pre-partitioned sub-matrices
17/09/24 15:02:16 INFO client.RMProxy: Connecting to ResourceManager at dumbo060/172.20.1.60:8032
17/09/24 15:02:17 INFO input.FileInputFormat: Total input paths to process : 840
17/09/24 15:02:17 INFO mapreduce.JobSubmitter: number of splits:20
17/09/24 15:02:17 INFO mapreduce.JobSubmitter: Submitting tokens for job: job_1505043511289_0175
17/09/24 15:02:17 INFO impl.YarnClientImpl: Submitted application application_1505043511289_0175
17/09/24 15:02:17 INFO mapreduce.Job: The url to track the job: http://dumbo060:8088/proxy/application_1505043511289_0175/
17/09/24 15:02:17 INFO mapreduce.Job: Running job: job_1505043511289_0175
17/09/24 15:02:22 INFO mapreduce.Job: Job job_1505043511289_0175 running in uber mode : false
17/09/24 15:02:22 INFO mapreduce.Job:  map 0% reduce 0%
17/09/24 15:11:29 INFO mapreduce.Job:  map 100% reduce 0%
...
When the computation is finished, you will see the following messages.
[Radius] The effective radius for each vertex is stored in HDFS pegasus/radius/google.
PegasusN>
Graph generation
PegasusN provides graph generators which follow representative graph generation models such as R-MAT and Kronecker. In this demo, we generate an R-MAT graph. To generate an R-MAT graph, you may use `generate rmat` command. The command receives some additional parameters such as the name of generated graph, the level of recursion, the number of edges, the probabilities of R-MAT model, and so on.
PegasusN> generate rmat
Enter parameters: [graph name] [parallelism]: rmat 20
Enter model parameters: [level of recur.] [# of edges] [a] [b] [c] [d] [noise]: 20 10000000 0.5 0.25 0.15 0.1 0.12
17/09/24 15:17:10 INFO graphgen.RMATGenerator: lv: 20, numEdges: 10000000, numTasks: 20, abcd: ([0.5, 0.25, 0.15, 0.1])
17/09/24 15:17:11 INFO zlib.ZlibFactory: Successfully loaded & initialized native-zlib library
17/09/24 15:17:11 INFO compress.CodecPool: Got brand-new compressor [.deflate]
17/09/24 15:17:14 INFO client.RMProxy: Connecting to ResourceManager at dumbo060/172.20.1.60:8032
17/09/24 15:17:38 INFO input.FileInputFormat: Total input paths to process : 20
17/09/24 15:17:38 INFO mapreduce.JobSubmitter: number of splits:20
17/09/24 15:17:38 INFO mapreduce.JobSubmitter: Submitting tokens for job: job_1505043511289_0178
17/09/24 15:17:39 INFO impl.YarnClientImpl: Submitted application application_1505043511289_0178
17/09/24 15:17:39 INFO mapreduce.Job: The url to track the job: http://dumbo060:8088/proxy/application_1505043511289_0178/
17/09/24 15:17:39 INFO mapreduce.Job: Running job: job_1505043511289_0178
17/09/24 15:17:53 INFO mapreduce.Job: Job job_1505043511289_0178 running in uber mode : false
17/09/24 15:17:53 INFO mapreduce.Job:  map 0% reduce 0%
17/09/24 15:17:58 INFO mapreduce.Job:  map 55% reduce 0%
...
When the generation step is finished, you will see the following messages.
[RMAT] The generated RMAT graph rmat is stored in HDFS pegasus/graphs/rmat.
PegasusN>
Plotting results
How can we analyze the results of algorithms? PegasusN provides useful visualization tools for analyzing the results of algorithms.
Distribution
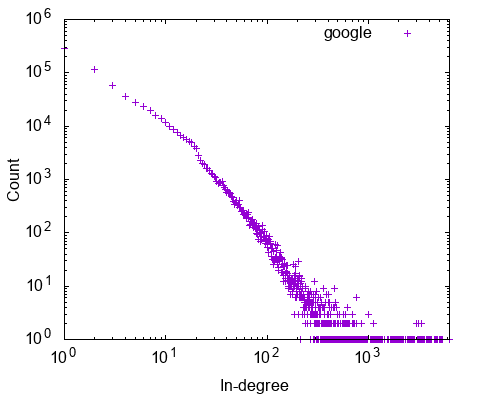
Once you have run the algorithms, you can plot the results to find interesting patterns and anomalies. We will show how to plot the distributions of degree, pagerank, radius, and the correlations among them.
The distribution of algorithm result is plotted by the `plot [algorithm] [graph_name]` command. For example, the degree distribution of the google graph is plotted by the `plot deg google` command. The output file google_deg_inout.eps is generated in the current directory. Here are the distributions plotted.


Adjacency matrix
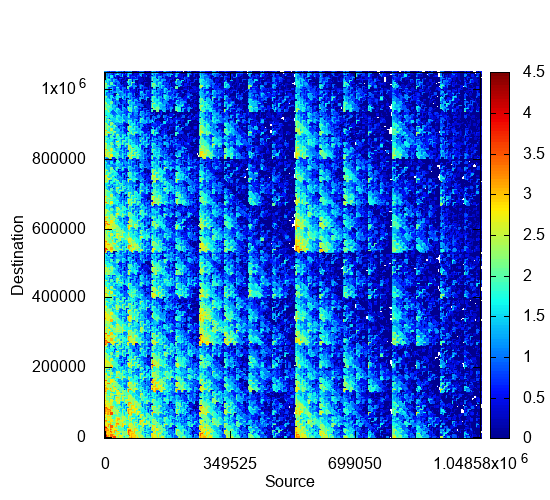
To visualize the graph, PegasusN provides a tool called NetRay. You can use NetRay for drawing a spy plot by running `plot spy rmat` command. NetRay summarizes a given large matrix into a smaller one, and draws a spy plot of the summarized matrix.
PegasusN> plot spy rmat
[Plot] Draw a spy plot of rmat graph.

-----===[PEGASUS: A Peta-Scale Graph Mining System]===-----

[PEGASUS] Drawing a spy plot. original nodes = 1048576, target nnodes = 1000, s_over_n = 2.881439595113874E-4, is_linear = 1

17/09/24 15:18:22 INFO client.RMProxy: Connecting to ResourceManager at dumbo060/172.20.1.60:8032
17/09/24 15:18:26 INFO input.FileInputFormat: Total input paths to process : 20
17/09/24 15:18:26 INFO mapreduce.JobSubmitter: number of splits:20
17/09/24 15:18:27 INFO mapreduce.JobSubmitter: Submitting tokens for job: job_1505043511289_0179
17/09/24 15:18:27 INFO impl.YarnClientImpl: Submitted application application_1505043511289_0179
17/09/24 15:18:27 INFO mapreduce.Job: The url to track the job: http://dumbo060:8088/proxy/application_1505043511289_0179/
17/09/24 15:18:27 INFO mapreduce.Job: Running job: job_1505043511289_0179
17/09/24 15:18:33 INFO mapreduce.Job: Job job_1505043511289_0179 running in uber mode : false
17/09/24 15:18:34 INFO mapreduce.Job:  map 0% reduce 0%
17/09/24 15:18:39 INFO mapreduce.Job:  map 5% reduce 0%
17/09/24 15:18:40 INFO mapreduce.Job:  map 75% reduce 0%
...
When the summarization step is finished, you will see the following messages.
[PEGASUS] Spyplot data generated.
[PEGASUS] Output is saved in the HDFS pegasus/spy/rmat
[Plot] The spy plot of rmat graph is saved in spy_rmat.eps.
PegasusN>
The following figure shows the summerized spy plot of adjacency matrix. You can see the recursive pattern of RMAT model in the figure.